
| Event | Ph.D. - Quantitative Research Workshop |
| Session | 2022-23 |
| Date | 2nd December, 2022 – 20th January, 2023 |
| Faculty | Sudnya Mahimkar, Smita Dalvi |
| Guest Speaker | Dr. Pooja Purang, Prof. Sabitha Praveen |
Aim:
To perform Quantitative research – to attain greater knowledge and understanding of the social world.
Definition:
Quantitative data analysis simply means analysing data that is numbers-based – or data that can be easily “converted” into numbers without losing any meaning.
Need of Quantitative Research
- Firstly, it’s used to measure differences between groups. For example, the popularity of different clothing colours or brands
- Secondly, it’s used to assess relationships between variables. For example, the relationship between weather temperature and voter turnout
- And third, it’s used to test hypotheses in a scientifically rigorous way. For example, a hypothesis about the impact of a certain vaccine
Aim:
The study and better understand data, measure uncertainty, and calculate risk. The applications of such knowledge are widespread – from economics to medicine. In PhD, Statistics will give you a deep understanding of the mathematical framework which underpins data analysis as we know it.

The role of statistics in research is
- To function as a tool in designing research
- Analysing its data
- Drawing conclusions therefrom
While designing any survey for research, following points need to be considered.
- The primary aim of conducting the survey.
- How do you plan to utilize the collected survey data.
- The type of decisions you plan to take on the basis of the above-mentioned points.
- Statistics is the collection of data, it’s interpretation and representation.
- Statistical analysis is the science of uncovering patterns and trends
- Statistics provides a way of organizing data to get information on a wider and more formal (objective) basis than relying on personal experience (subjective)
Features of Statistics
- Aggregate of Facts: It is only the aggregate of facts capable of offering some meaningful conclusion that constitute statistics.
- Numerically Expressed: Statistics are expressed in terms of numbers. If the height of Kapil Dev is 6’2”, it would be taken as statistical information.
- Affected by Multiplicity of Causes: These are influenced by many factors simultaneously.
- Reasonable Accuracy: A reasonable degree of accuracy must be kept in view while collecting statistical data.
- Pre-determined Purpose: Statistics are collected with some pre-determined objective.
- Enumerated or Estimated: Statistics may be collected by enumeration or these may be estimated.
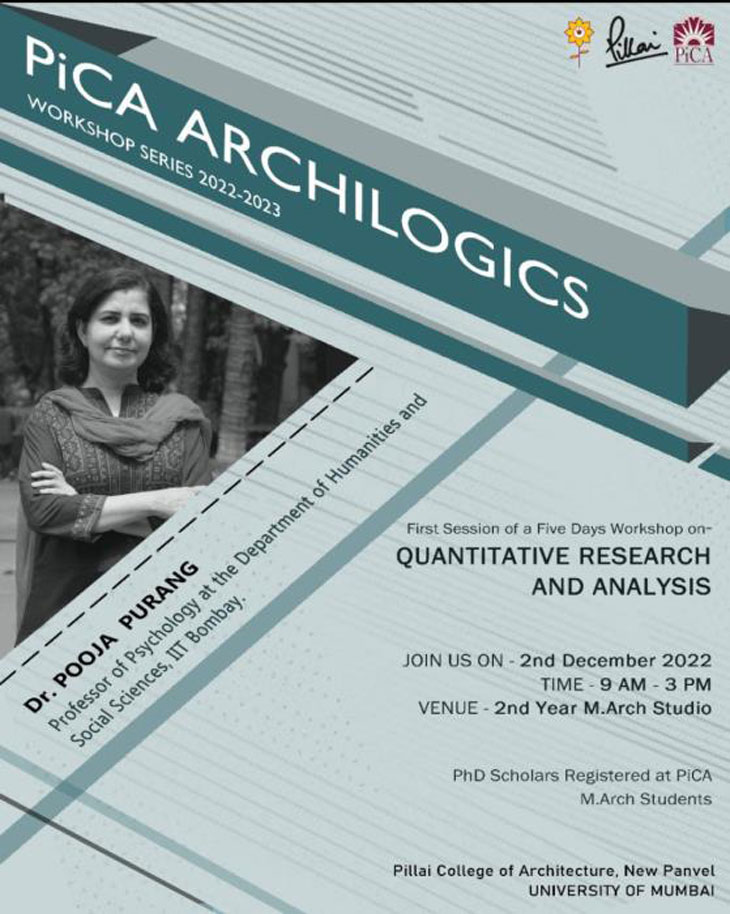
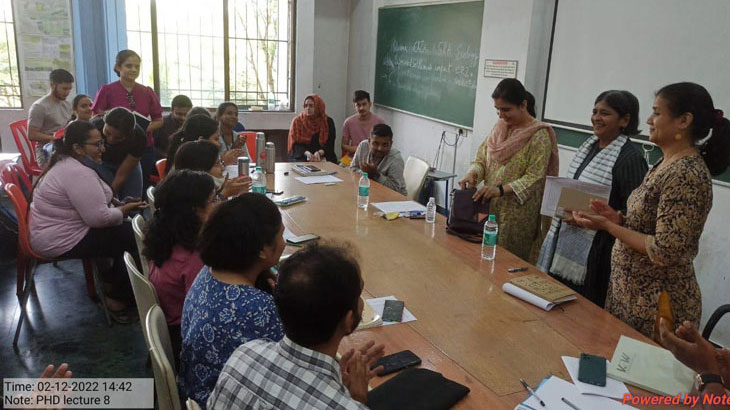
Session 1 was conducted by Dr. Pooja Purang – Professor of psychology at department og humanities and Social Science, IIT Bombay.
Session 1 conducted on 2nd December, 2022 (Quantitate Research and Analysis)
- Formulating research Question
- Types of research design
- Experimental
- Validity
- Generalised
- Neutrality
- Reliability
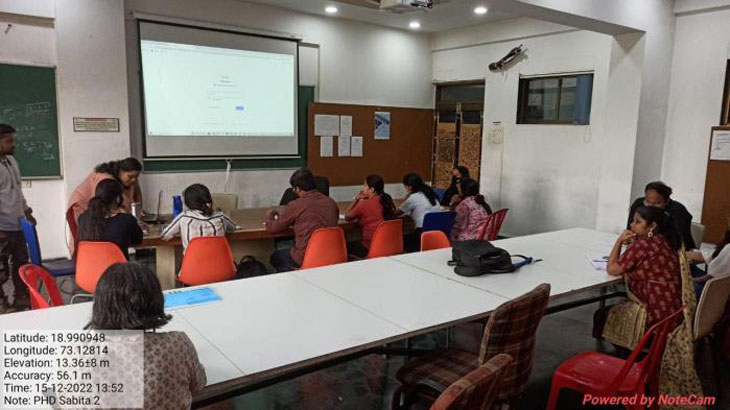
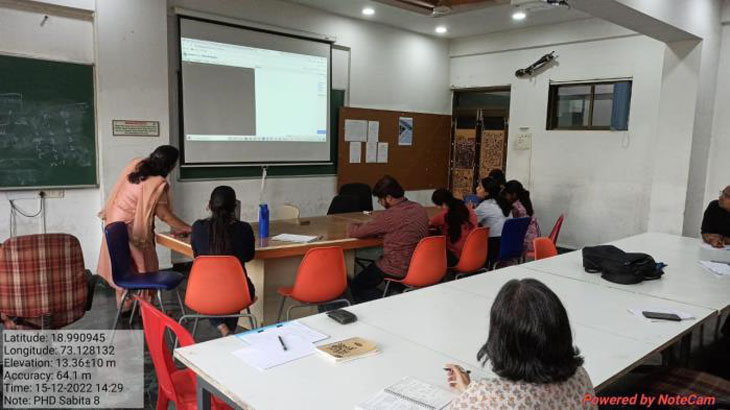
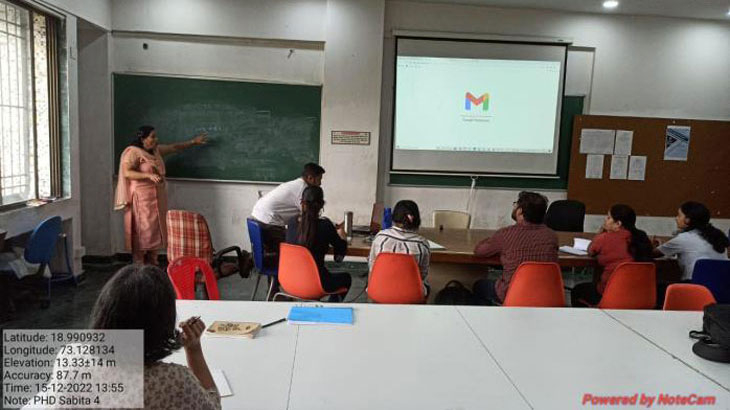
Future Session (2 to 5 were conducted by Prof. Sabitha Praveen)
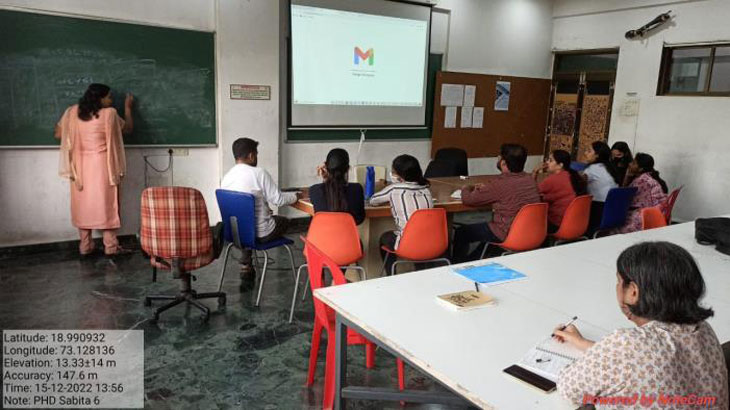
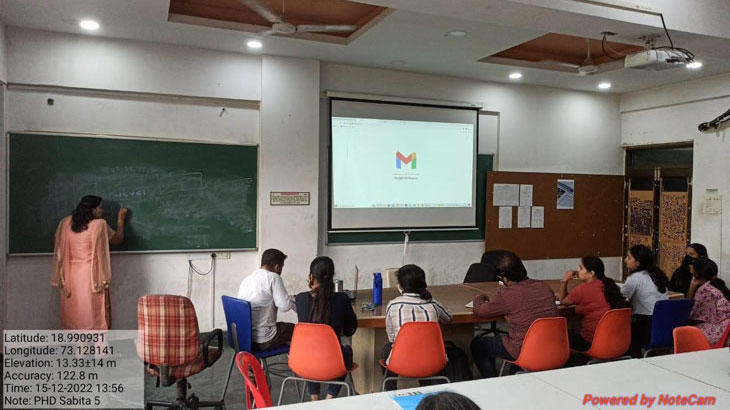
Session 2 conducted on 15th December, 2022 (Statistic)
- Understanding Statistic
- Qualitative and quantities methods
- Sample Survey methods
- Probability Sample techniques
- Non probability Sample techniques
- Measurement Scale
- Nominal data
- Internal scale
- Ratio Scale
- Finding Arithmetic mean
- Median value
- Mode value
Session 3 – conducted on 23rd December, 2022 (Statistic)
- Calculation of Correlation Coefficient
- Regression analysis using least square method
Session 4 – conducted on 6th January, 2023 (Statistic)
- Collocation of Mean value
- Confidence Interval Sampling
- Test Statistic
- P Value
- Types of Errors
Session 5 conducted on 20th January, 2023 (Statistic)
- Pair Sample
- D test
- Anova – (Software Learning)